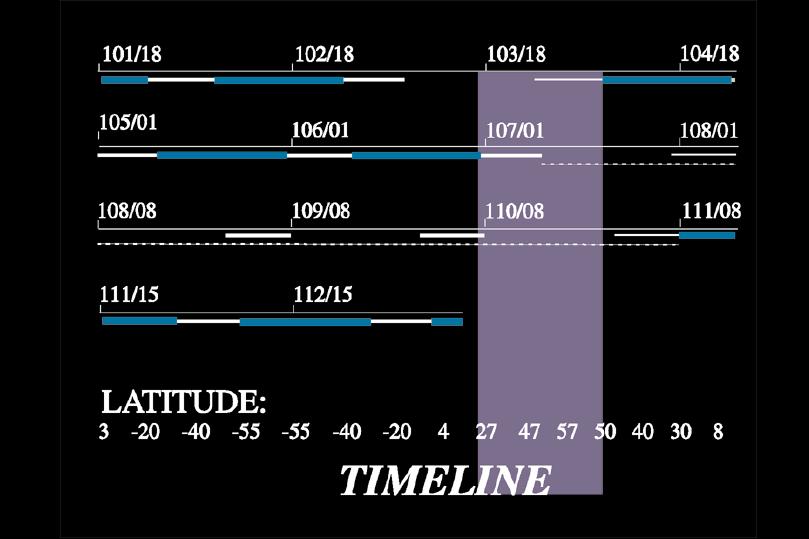
This is a sample timeline of the 100 kilometer orbit. These are the actual days we're going to be in orbit, although thetimes alloted for dowlink and NLR are just guesses. Each number on the line gives the date and time: for example, 101/18 means the hundred and first day of the year two thoudand, at six p.m.
At the bottom of the slide is a lattitude chart. You can figure out what lattitude the spacecraft is at any time by drawing a line down to the chart -- for instance, the spacecraft is at -55 degrees lattitude at 109/08.
The lines underneath each line indicate what's happening at that point in time. The short white horizontal lines mean that the spacecraft is sending data back to earth, and has its instruments pointed away from Eros. The dotted white horizontal line means that the NEAR laser rangefinder team has control of the spacecraft, and we don't know if we'll be able to take pictures or not. The blue horizontal lines are the times we can take pictures.
If you look at the positions of the blue lines and the lattitude chart, you can see that there are some lattitudes we never get to take pictures of -- that's what the horizontal purple stripe represents.
A final problem we encountered in doing these simulations was uncertainly. We only know the shape, mass, and moment of inertia of the asteroid to within about ten percent. If any of these are off by even five percent, a lot of our simulations would be completely useless. So we had to run simulations for a couple of different cases.